Introduction
The grain size analysis test is performed to determine the percentage of each size of grain that is contained within a soil sample, and the results of the test can be used to produce the grain size distribution curve. This information is used to classify the soil and to predict its behavior. The two methods generally used to find the grain size distribution are:
- Sieve analysis which is used for particle sizes larger than 0.075 mm in diameter and
- Hydrometer analysis which is used for particle sizes smaller than 0.075 mm in diameter
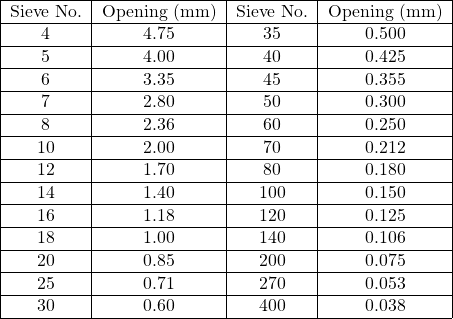
Sieve analysis is a method that is used to determine the grain size distribution of soils that are greater than 0.075 mm in diameter. It is usually performed for sand and gravel but cannot be used as the sole method for determining the grain size distribution of finer soil. The sieves used in this method are made of woven wires with square openings. The list of the U.S. standard sieve numbers with their corresponding opening sizes are provided in Table 3.1.
Table 3.1: U.S. Sieve Size
Practical Application
- This test method is used primarily to grade aggregates. The results are used to determine the compliance of the particle size distribution with applicable specification requirements and to provide necessary data for controlling the production of various aggregate products and mixtures containing aggregates.
- The data may also be useful in developing relationships concerning porosity and packing. Information obtained from the particle size analysis (uniformity coefficient Cu, coefficient of curvature, Cc, and effective size, D10, etc.) is used to classify the soil.
- Particle size is one of the criteria used to ascertain whether the soil is suitable for building roads, embankments, dams, etc.
- Information obtained from particle size analysis can be used to predict the soil-water movement if the permeability test is not available.
Objective
- To obtain the grain size distribution curve for a given soil sample.
Equipment
- Stack of sieves with a cover,
- Mortar and pestle or a mechanical soil pulverized
- Balance, sensitive to 0.1 g
- Oven
- Mechanical sieve shaker
- Brush
Standard Reference
- ASTM D6913: Standard Test Methods for Particle-Size Distribution (Gradation) of Soils Using Sieve Analysis.
Method
- Obtain a representative oven-dried soil sample.
- Pulverize the soil sample as finely as possible, using a mortar and pestle or a mechanical soil pulverizer.
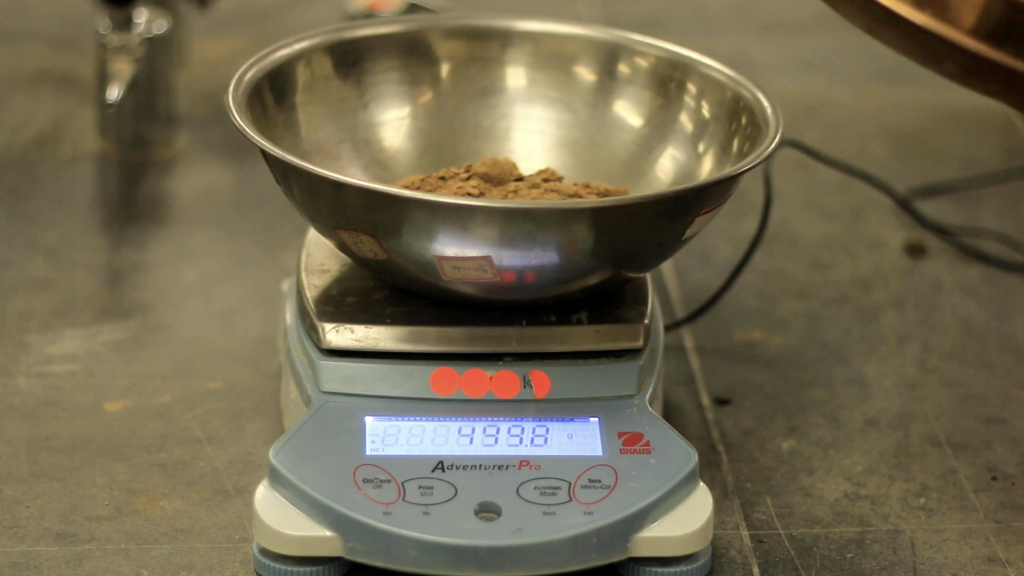
- Obtain a soil sample of about 500 g and determine its mass W0 (g).
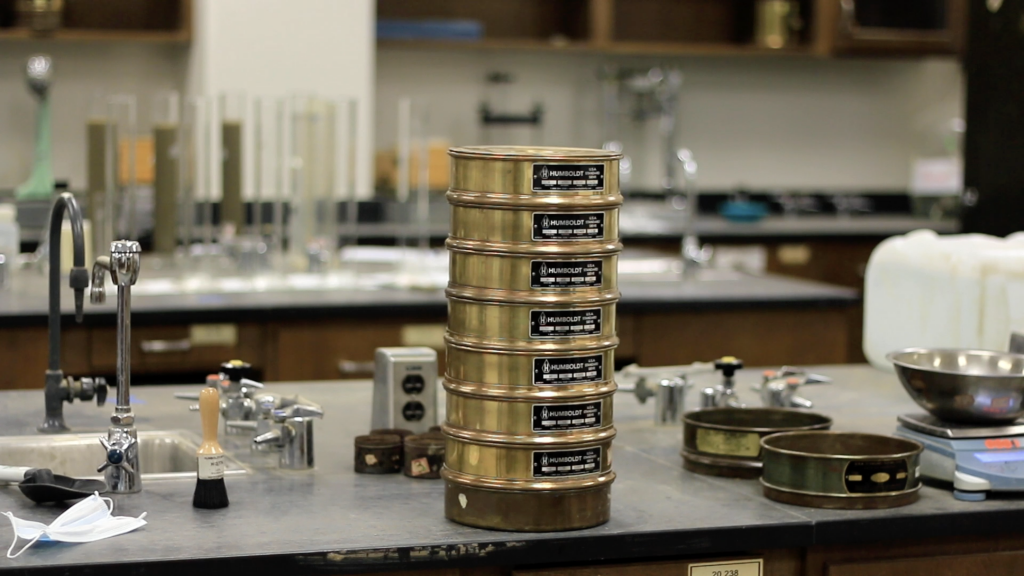
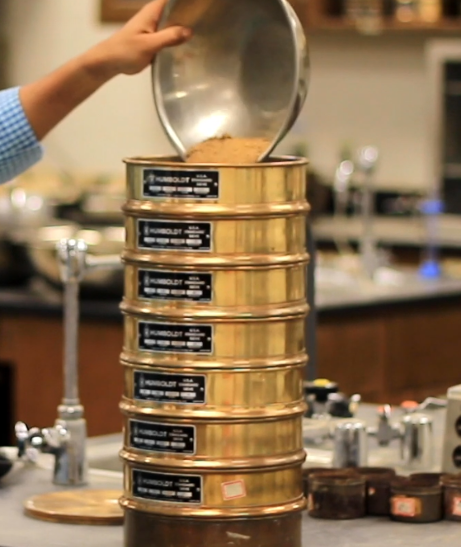
- Stack the sieves so that those with larger openings (lower numbers) are placed above those with smaller openings (higher numbers). Place a pan under the last sieve (#200) to collect the portion of soil passing through it. The #4 and #200 sieves should always be included in the stack.
- Make sure the sieves are clean, If soil particles are stuck in the openings, use a brush to poke them out.
- Weigh the pan and all of the sieves separately.
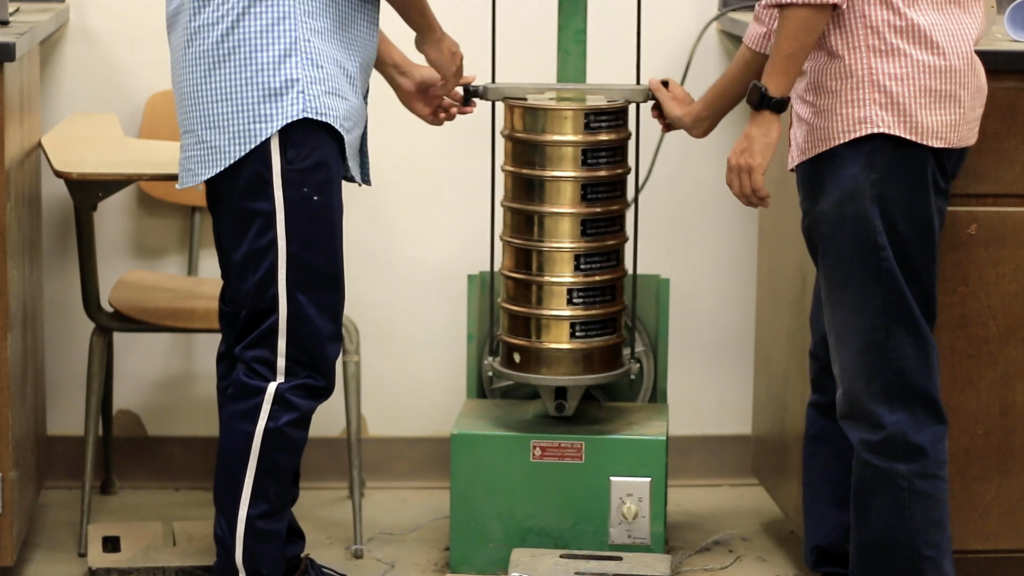
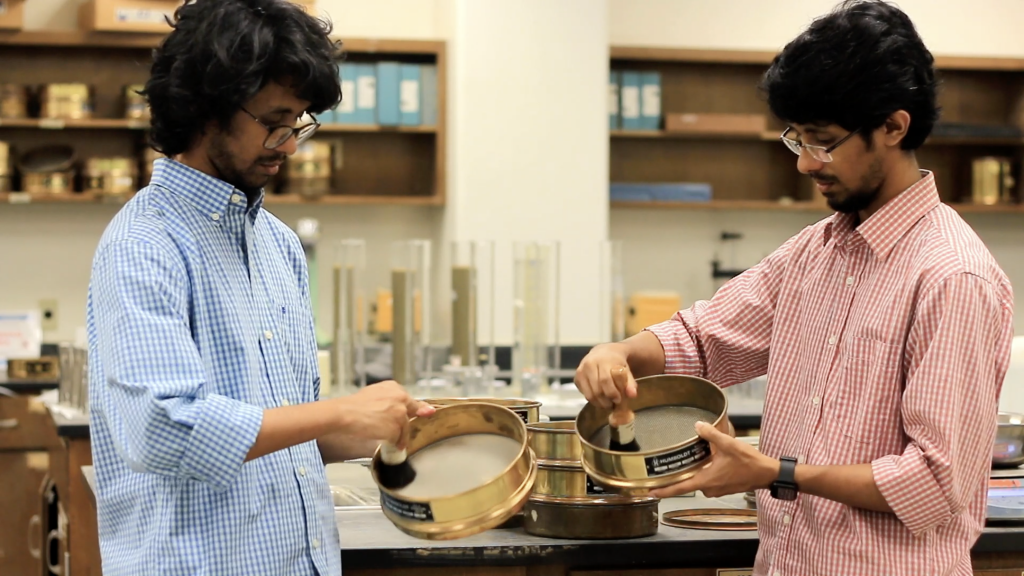
- Pour the soil from above into the stack of sieves and place the cover on it. Put the stack in the sieve shaker, affix the clamps, set a timer for 10 to 15 minutes, and start the shaker.
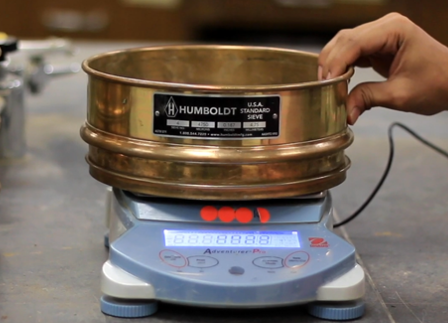
- Stop the sieve shaker and measure the mass of each sieve and retained soil.
Video Materials
Lecture Video
A PowerPoint presentation is created to understand the background and method of this experiment.
Demonstration Video
A short video is executed to demonstrate the experiment procedure and sample calculation.
Results and Discussions
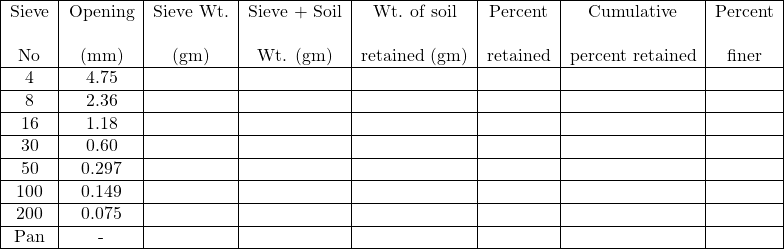
Sample Data Sheet
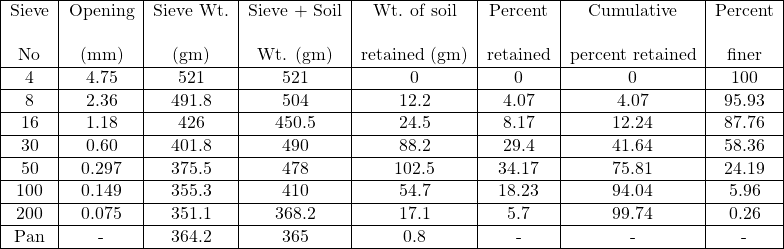
Sample Calculation
For #8 sieve,
Sieve weight = 491.8 gm
Sieve + soil weight = 504 gm
Weight of soil retained = (504 – 491.8) = 12.2 gm
Percent retained= $2.2/300 × 100 = 4.07%
Cumulative percent retained= 0 + 4.07 = 4.07%
Percent finer= 100 – 4.07= 95.93%
The grain-size distribution of the soil sample can be obtained by plotting the percent finer with the corresponding sieve on semi-log graph paper, as shown below. An example of the grain-size distribution curve is shown in Figure 3.7.
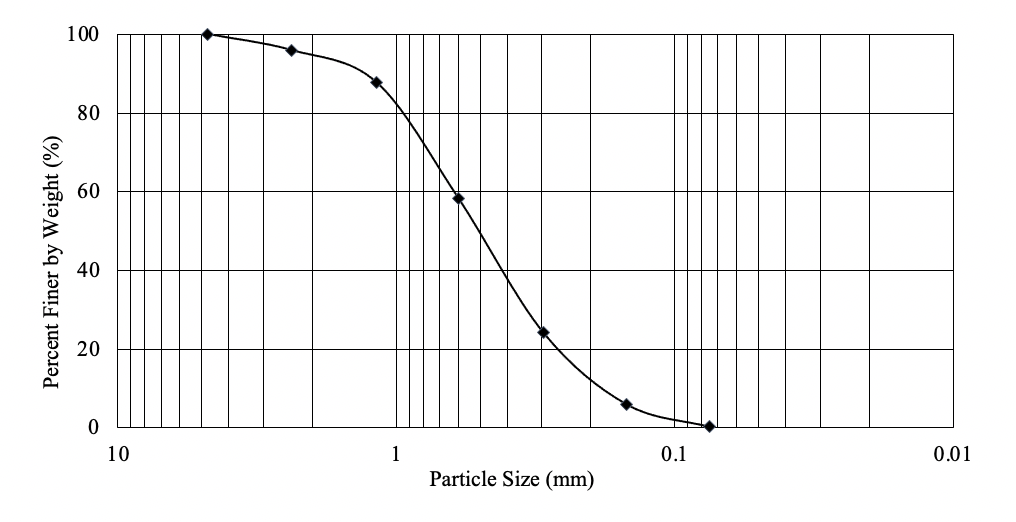
he values of D10, D30, and D60, which are the diameters that correspond to the percentfiner of 10%, 30%, and 60%, respectively can be determined from the grain-size distributioncurve. The values of the uniformity coefficient Cu and the coefficient of gradation Cc can be calculated using the following equations:
The values of Cu and Cc are used to classify whether the soil is well-graded or not. Sand isconsidered well-graded, if Cu is greater than 6 and Cc is between 1 and 3. For gravel to be considered as well-graded, Cu should be greater than 4 and Cc should be between 1 and 3.
Blank Data Sheet
Report
Use the template provided to prepare your lab report for this experiment. Your report should include the following:
- Objective of the test
- Applications of the test
- Apparatus used
- Test procedures (optional)
- Analysis of test results – Complete the table provided and show one sample calculation. Draw the grain size distribution curve. Calculate Cu and Cc
- Summary and conclusions – Comment on the shape of the grain size distribution curve of the given soil sample. Comment on whether the soil is well graded or poorly graded.
License
Properties and Behavior of Soil - Online Lab Manual Copyright © 2021 by MD Sahadat Hossain, Ph.D., P.E.; Md Azijul Islam; Faria Fahim Badhon; and Tanvir Imtiaz is licensed under a Creative Commons Attribution-NonCommercial 4.0 International License, except where otherwise noted.
